
Stalking a local Desert City Agent in the summer
Desert Cities Sales Statistics: We are all reading about how total sales are down in Orange and L.A. Counties, but how is that translating to our Desert Cities? I took to the MLS for stats on the changes between the first Q sales for 2018 compared to the First Q sales for 2019 in all 9 Desert Cities. Even if you’re just thinking about purchasing a property in the Coachella Valley, good to look at what’s going on. For more information about a particular area, or desert city, give local agent, Kim Kelly a call at 760-285-3578.
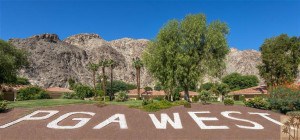
PGA West in La Quinta, CA. allows nightly rentals.
There are all kinds of stats that can be compiled for real estate, but I am just going to present two of the stats that are my favorites..the number of Listings, and the numbers of sold. How are they stacking up Quarter Vs. quarter, one year ago to now. So here goes..from our most Westerly Desert City, Palm Springs, to our Most Easterly Desert Cities, Coachella and Thermal.
Palm Springs: Available properties down 10.8%, Closed Properties down 2.7%
Cathedral City: UP 4.2%, down 17.5%
Rancho Mirage: UP 5.8% down 17.8%
Palm Desert: down 6.4% down 11.6%
Indian Wells: down 4.5%, down 7.8%
La Quinta: down 7.5%, down 13.5%
Indio: UP 20.6%, down 12.2%
Thermal & Coachella: down 7.1% down 11.5%
This is a new listing at 54521 Calhoun St., Thermal, CA. This is the Warehouse on the property..