
Coachella valley market update
Coachella valley real estate market: Buyers are still active, and the inventory is low, so both buyers and sellers can get their property IF they are reasonable and the price is right! Local agent and resident, Kim Kelly 760-285-3578.
Through our Coachella Valley, a total of 570 single family homes have been sold since this time last year, that’s an increase over last year. Homes take longer to sell, averaging 75 days on the market, which is a bit slower than last year.
The median price is $675,000 which is down about 7%, which gives buyers more negotiating power, but also slowing the pace of appreciation. Remember that the median price means the number that half of the homes sell above and half sell below.
Sellers who priced correctly received 95% of their list price, but only 28% of homes sold over ask. Price/sf dipped to $347/sf, about a 2% drop.
Inventory dropped alot..about 22% to approx 2,697 homes actively listed for sale.
There are approx. 6 months of housing supply which is down approx 25% which indicates a more stable market.
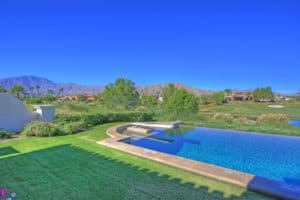
What this means for SELLERS is that if priced right, you will sell your property. Condos are still selling well and demand is strong. Priced right, your condo will sell. For BUYERS, you have breathing room in single family homes, while condos are selling quicker so don’t mess around too much with the price! The house below is in La Cantera, La Quinta. I listed and sold this in just over 30 days. There are several homes available in this community today, so if you’re looking to buy or sell in the Coachella Valley, give me a call at 760-285-3578.
More
Luxury Sales in the Coachella Valley over the past 6 months
Luxury Sales in Coachella Valley: So everyone knows that real estate isn’t screaming right now, but how is the Luxury market holding up here in the Coachella Valley? We continue to see properties from the West city of Palm Springs to the East Valley city of La Quinta, priced at 3 million and above doing very well! Golf course communities are doing particularly well among residential sales, and there have been some large estate properties further East that are selling as well.
The Best selling Properties in Coachella Valley
- The Madison Club, La Quinta: This club has become the top seller in the valley, surpassing Bighorn, Eldorado and The Reserve, with 7 homes selling in the past 6 months. Prices ranged from approx 12 million for a 6432 sf home with 6 bed/7 ba to 16.5 million for a 9374 sf, 5 bed/6 bath home built in 2019. The HOA at The Madison is $1652/month. This private golf club is consistently the top seller.
- Toscana Country Club, Indian Wells: Toscana saw a jaw dropping sale at $11,375,000 for a 2013 built home of 9867 sf with 5 beds/7baths. HOA at Toscana is $750/month
- The Hideaway, La Quinta: Many people buy at Hideaway to try the desert golf scene, then sell and move up to The Madison, both developed by Discovery. Top sale at The Hideaway comes in at $11,300,000 for 8410 sf with 6 beds/8baths and built in 2021. HOA is $800/month
- Eldorado Country Club, Indian Wells: This private, by invitation only club is one of our originals. HOA is $597/month and their highest sale came in at $9,250,000 for a 5368 sf 4 bedroom/6bathroom 1973 build home remodeled in the contemporary style.
- Bighorn Golf Club, Palm Desert: Still a very popular golf club up Hwy 74 with down valley views. $8,995,000 was their top sale for 7471 sf, 5 beds/7baths home built in 2009.
- La Quinta Polo Estates, La Quinta: This small gated, non golf community is unique in that it offers 1-2 acre parcels and allows horses. HOA is $35 and there was a 9200 sf home with 6 beds/8 baths, built in 1991.
- Palm Springs, Old Las Palmas: No golf, but lots of history and a recent sale of 6.4 mil for a 4588 sf home, built in 2021 and offering 4 beds/5 baths.
- The Quarry, La Quinta: Beautiful golf club in the Eastern Coachella Valley with an HOA of $605/mo. Recently closed here for 6 mil was a beautiful contemporary built in 2001 with 8346 sf and 5 beds/7baths.
- PGA West, La Quinta: PGA encompasses approx 1200 acres and offers 6 golf courses, but there is one exclusive neighborhood called The Peninsula with an HOA of $1384/mo. This 2007 built, 7994 sf home featured 5 beds/7 baths and closed at 6 million.
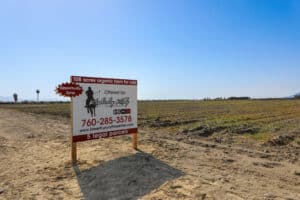
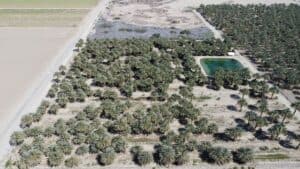
Take a tour of this amazing offering. 35 acre private, luxury date production facility with 2 homes, just a mile or so from The Madison Club. Zoned commercial and medium density residential, offered at 8 million.
More
Land, ranches and residential in the Coachella Valley
Coachella Valley Housing Update: Today I am going to borrow information from Lawyers Title Co., Kevin Wahlstrom. Fantastic customer service by the way, and I use Lawyers often. The Coachella Valley local housing update is just part of this very comprehensive Riverside Co., housing update. Great information. If you are looking to buy or sell here in the Coachella Valley, give local resident and realtor, Kim Kelly a call at 760-285-3578.
The second half of 2025 started with mortgage rates above 7%, and didn’t drop into the 6’s until mid February. The affordability crisis has persisted and demand has remained pretty much unchanged over the past 2 years. Days on the market has increased, buyer demand is muted and homeowners continue to “hunker down” in their homes, unwilling to move due to their under market, locked in rates. The only change in the trajectory of buyer demand that is being predicted is if the mortgage rates fall to 6% or below.
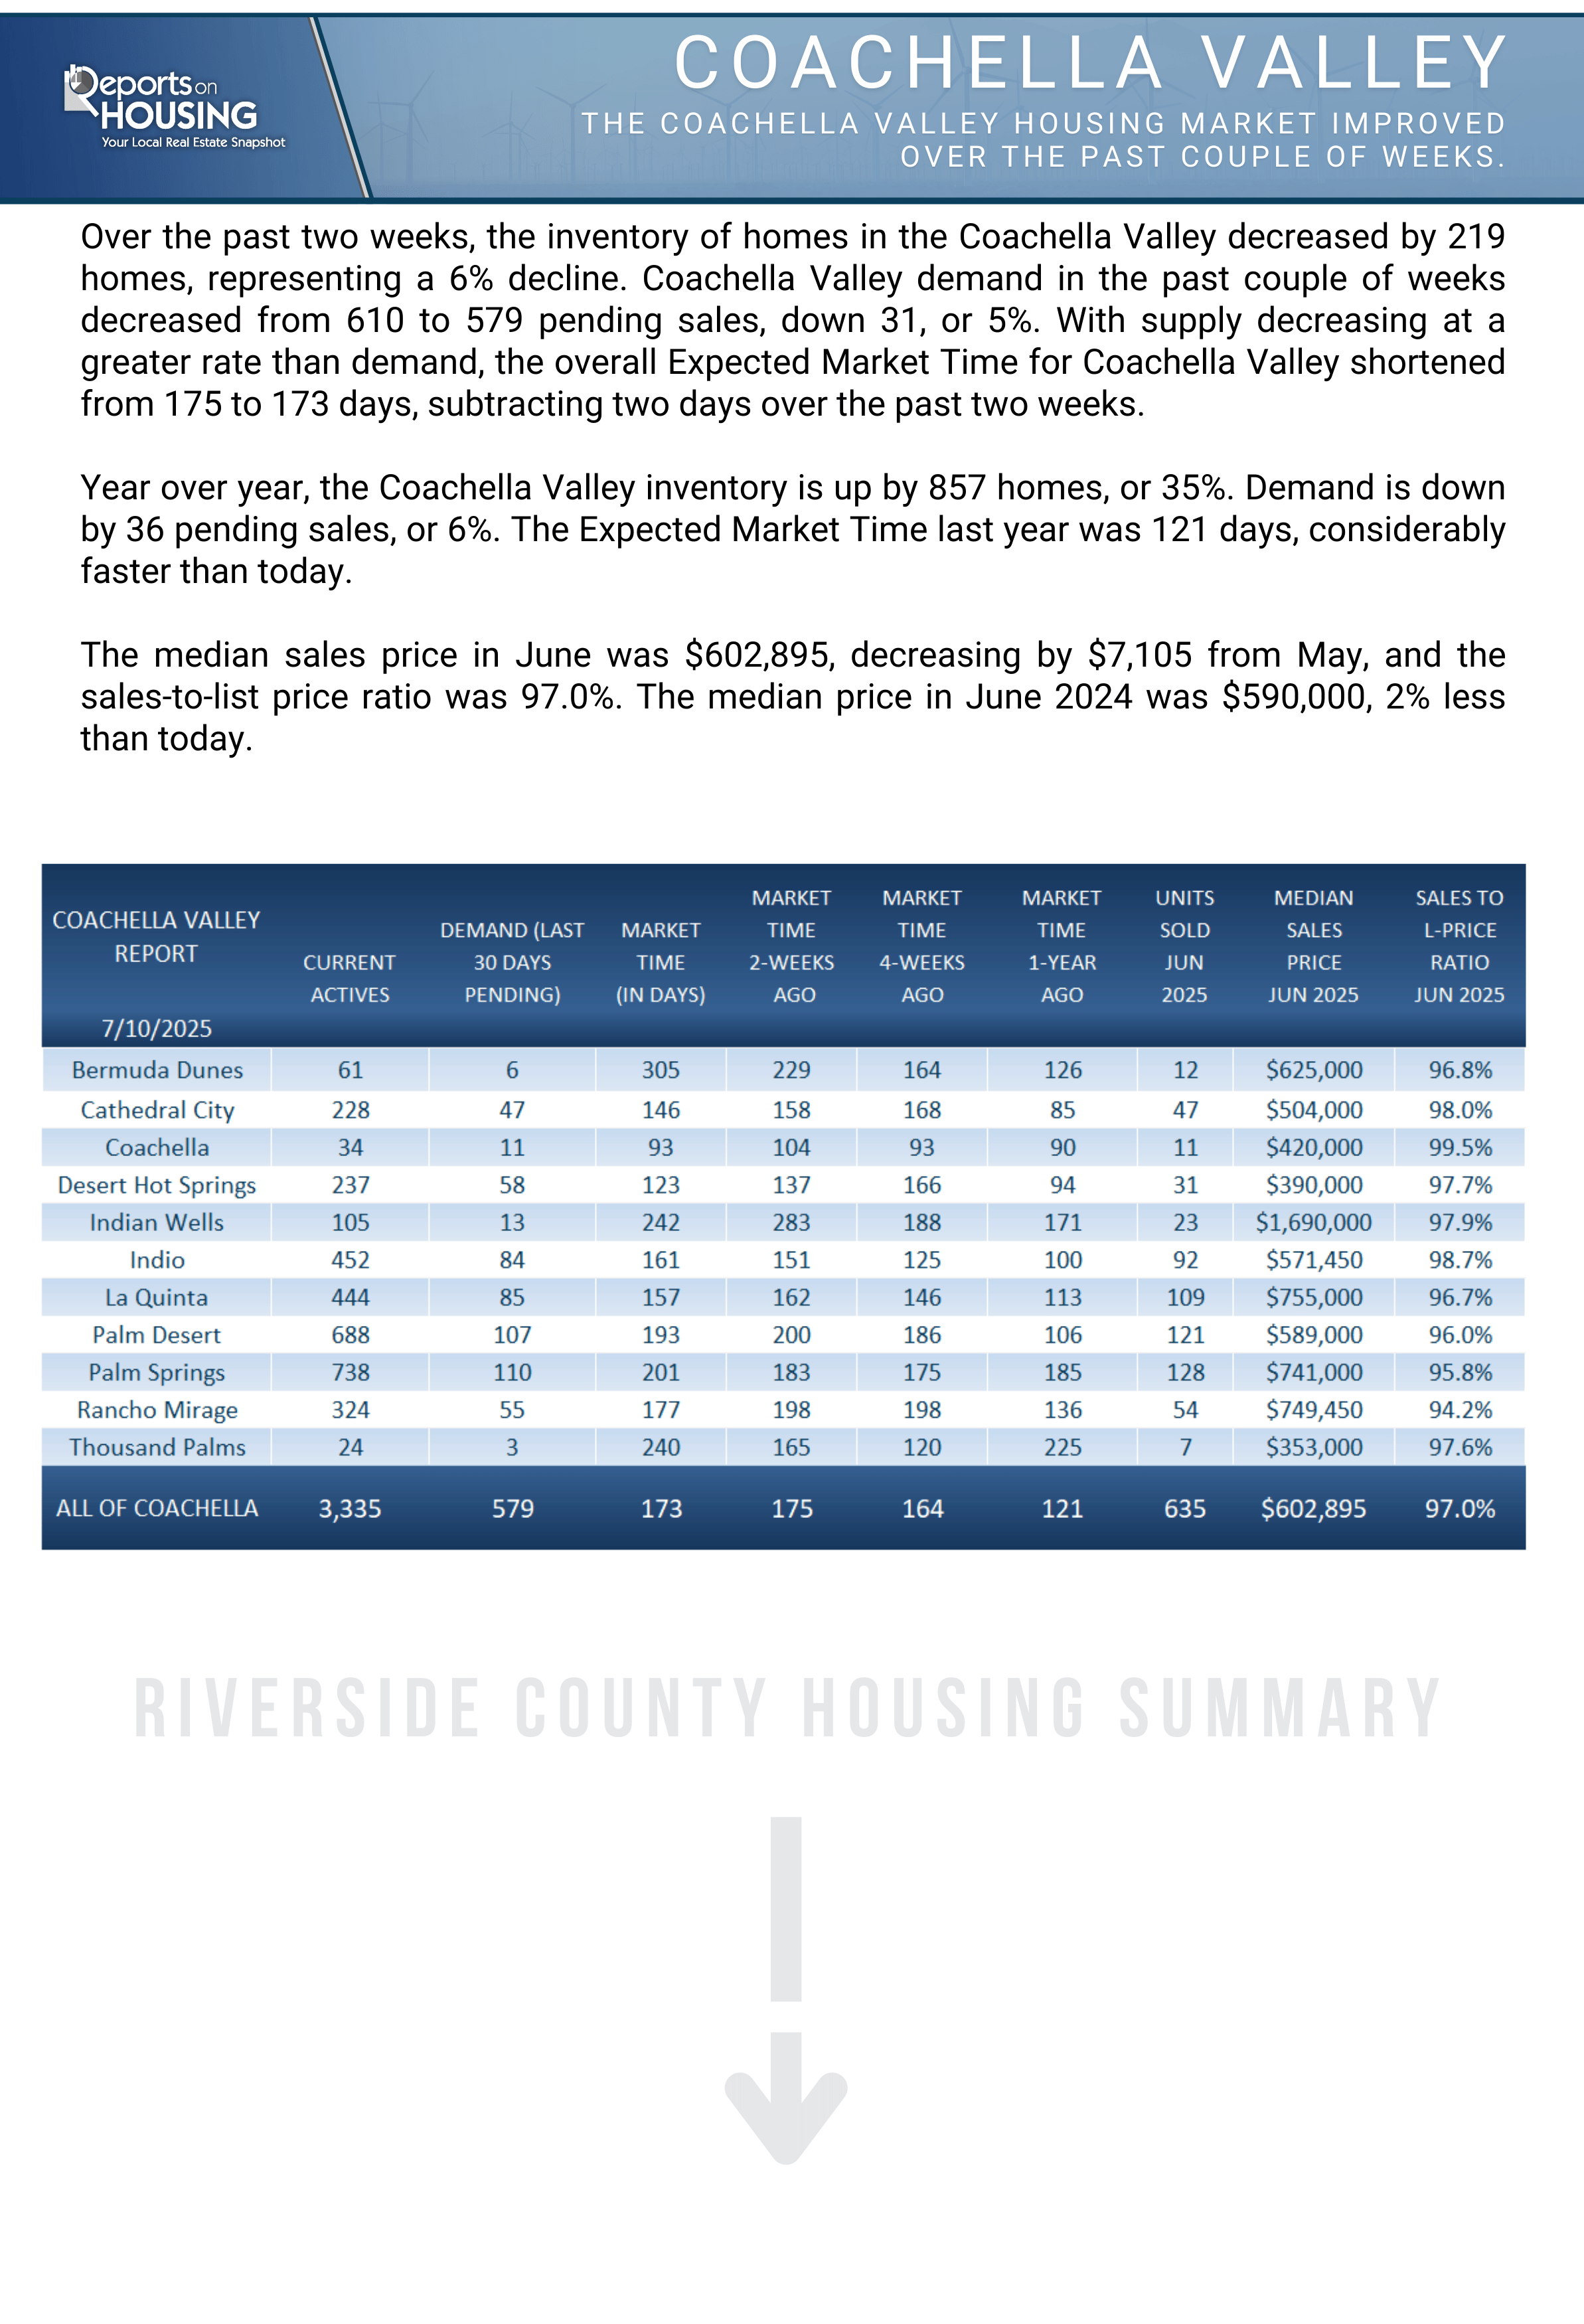
Coachella Valley snapshot
Over the past 2 weeks, inventory decreased by 219 homes, a 6% decline. Demand in the past 2 weeks decreased from 610 to 579 pending sales, down 5%. Year over year, the Coachella Valley inventory is up by 857 homes, or 35%. Demand is down by 36 pending sales or 6%. The expected market time last year was 121 days, considerably faster than today. The median sales price in June was $602,895 decreasing by $7,105 from May. The median price in June 2024 was $590,000 which is 2% less than today. (Information is courtesy of Lawyers Title Co.)
Take a look at this amazing 9.8 acre organic date farm being offered for just $795,000.
More
The Hideaway Golf Club in La Quinta, CA.
Foreclosures in Coachella Valley I’m just talking about the Eastern Coachella Valley today. The local desert cities of Palm Springs, Cat City, Palm Desert, Rancho Mirage, La Quinta, Indio, Indian Wells, Thermal, and Coachella. I am not seeing many foreclosures as I show the Coachella Valley cities. I handled many Short Sales during the last crash, and am always keeping my ears and eyes open for any trends that may be pointing to another Foreclosure crisis. If you are looking to buy or sell, give local resident/agent, Kim Kelly a call at 760-285-3578.
According to Zillow and Redfin, there are zero foreclosures in all but two of the Coachella Valley cities. There are currently 2 foreclosures in La Quinta, and 6 in Indio.
La Quinta: There is currently 1 foreclosure in the La Quinta Cove. $399,900. 1989 build of approx 1700 sf and on a single lot. Has a pool and looks to be in pretty decent condition.
The Hideaway: There is 1 foreclosure at the gorgeous Hideaway Golf Club in La Quinta. This gorgeous contemporary style home built in 2023 is approx 4370 sf, includes a casita and is listed for $4,250,000, sits on a 16.000 sf lot, and is gorgeous. Hideaway has a monthly HOA of approx. $800/month.
The city of Indio has 6 foreclosed properties ranging in price from a mobile for $158,000 to $709,000.
A foreclosed 10 acre farm in Thermal with date trees just closed recently at approx $650,000.
So, no, I am not seeing alot of foreclosures released for sale in the Coachella Valley BUT throughout the US, foreclosures have climbed 9% from last year.
The property tour below is NOT for a foreclosed property, but it IS a gem. 4 acre fenced, private estate with a custom home built in 1981, pool/spa/outdoor cook station, 4 irrigated pastures and although it feels like a rural estate in the country, the entry is right off of a small street with direct access to Washington. 42605 Byron Pl., Bermuda Dunes. List Price: $2,799,000.
More
Coachella Valley is home to many estate properties
Coachella Valley Market Update: Here we are one month away from the end of the first quarter, and the California Department of real estate, along with the US Census, has put together a short breakdown of our local Coachella Valley real estate market. Sales are still down below normal, but most especially in the luxury market. Bottom Line, if a buyer brings your an offer, a seller needs to respond and seriously consider it. If you are looking to list your property in the Coachella Valley, give local agent, Kim Kelly a call at 760-285-3578.
Coachella Valley Market Update
* Coachella Valley Housing Inventory 1/1/25 3,389.
* Coachella Valley Housing Inventory as of 1/1/24 2,366.
* Population Growth in the Valley is Lagging 0.8% Down.
* Valley Home Prices are stable – No downward or upward pressure.
* Sales continue to run 26% below Normal.
* Inventory is now back to pre-covid averages.
* The luxury homes aren’t selling. Inventory of luxury homes is down 56%.
* Sales vs. Demand is now favoring buyers.
* 2025 Forecast on Mortgage rates is projected to declines to 5.75-6.0% range.
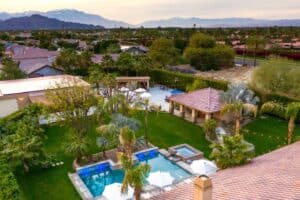
Take the tour of this just reduced La Quinta Cove property. Now offered at $649,000. Located on a double lot, with spectacular views from the fenced and private backyard. And what a yard. Mature trees encircle the yard with it’s Pool, raised spa, outdoor shower, multiple conversation areas and VIEWS!
More
Real estate thoughts for 2025
Real Estate maybe’s for 2025? Despite what some realtors think, none of us have crystal balls, and there is no way to be totally accurate. The following are four interesting takes on the 2025 upcoming market from Zillow Premier Agent blog. Anything that makes us think, and consider possible options is valuable! If you are looking to buy or sell in the Coachella Valley, give local realtor, Kim Kelly a call at 760-285-3578.
- Mortgage Rates: There was a short lived dip over the past 2 years, before the October rise, created some optimism and sales. 2024 was pretty tight on inventory, and Zillow predicts a more active housing market in 2025, with buyers having more of an upper hand. Some signs point to rates easing in 2025, but as we saw in 2024, rates rarely do what’s expected!
- Housing market Activity: Predictions are that it will pick up. There will be modest home value growth, the same as 2024. Zillow predicts 4.3 million in coming sales for 2025, up slightly from 4.1 mil in 2023, and a projected 4 mil in 2024.
- Buyers Market Predictions: According to Zillow’s market heat index, most buyers markets right now are in the Southeast. Predicted buyers markets will spread to the Southwest in 2025 as inventory continues to rise. However, if I rates fall amore than expected, that will dim the prospects of a Southwest spread.
- Housing types: Americans are really embracing small home living. The pandemic era need for more and more space is over. Home buyers will increasingly lean into smaller homes as a more sustainable, affordable and desirable way to live.
Predictions are just that..predictions! Zillow does fabulous market research, and research helps us understand what is happening, or may happen. Gather your information, but ultimately, buy a property if and when you are ready, and find that ONE!
More

Just another beautiful day in the Coachella Valley!
Coachella Valley real estate update: Inventory is up, days on market are up, medium sales price is also up in our Coachella Valley cities. Total sales are however, down about 32% over last year. (This info courtesy of the CDAR, which is the California Department of Real Estate). Call local agent, Kim Kelly for info on your home value, 760-285-3578.
The Coachella Valley Real Estate Summary
PRICES: Prices have begun their seasonal rise. The median price of a detached home in the Valley increased for the first time in six months. It ended November at $634,990, which is $15,000 above last year. The median attached price ended November at $447,000, which is $8,000 less than last year. Year over year price changes in detached homes range from a gain of 11% in Indian Wells to a decline of 7.6% in La Quinta. Gains of the average size attached home range from 15.4% in Desert Hot Springs to minus 3.4% in Indio.
SALES: When you take out seasonality, sales are running 32.1% below normal. The three-month average in November was 472 units compared to 477 units a year ago. In most cities, sales are comparable to year ago levels. Only the cities of Rancho Mirage, Coachella and Indian Wells have sales measurably less than last year. Dollar sales in November were $365 million, which is 3.4% below last year.
INVENTORY & “MONTHS OF SALES” RATIOS: Inventory is back to normal. On November 1st, Valley inventory was 3,187 units, which is 869 units higher than last year. We haven’t had inventory over 3,000 since 2020. The Valley’s “months of sales” ratio was 5.3 months, which is 1.5 months more than last year. We see consistent ratios between 5.5 and 7.0 months in most of the nine cities. The ratio in Indian Wells is now the highest at 15.3 months.
DIM: Selling times are coming down as the median selling time dropped for the second time in nine months. At the end of November, the median number of “days in the market” in the Coachella Valley was 43 days, which is only seven days more than last year. The city of Desert Hot Springs has the lowest average selling time at just 34 days. This is followed by Indian Wells at 35 days and Indio at 41 days. Rancho Mirage has the highest median selling time at 53 days.
PRICE DISCOUNTS/PREMIUMS: Price discounts are back to normal. Currently, detached homes are selling at an average discount of 2.1% compared to 2.1% a year ago. Attached homes are selling at a 2.6% discount. Coachella, Indio and Cathedral City have the smallest selling discount at 1.4% while Rancho Mirage is selling homes with the highest average discount of 3.4%. The percent of homes selling over list price is 15.0%. This is 1/2% less than last year. Take a tour of this gorgeous 9.8 acre date farm in Coachella, CA.
More

La Quinta offers many housing options.
Coachella Valley Market Update: Inventory is rising, buyers are coming back into town, price points are coming down a little bit, and the sun is out! Life is fabulous in the Coachella Valley, and our desert winters draw so many seasonal people to escape their cold locales and hang out in the valley for some sunshine. Local agent/resident, Kim Kelly 760-285-3578.
Rising Inventory
The Coachella Valley real estate market is experiencing a rise in active listings. Currently, there are 2,354 housing units available, up from 1,865 units last year. This surge of nearly 26% indicates a steady increase of properties onto the market throughout the year.
Declining Sales Activity
In contrast to the rising inventory, the number of sold listings has decreased. There were 363 homes sold this year, down from 411 a year ago, marking a decline of approximately 11.7%.
Pricing Trends
The average sale price has seen a notable decline to $704,961, which represents a 7.4% decrease from last year’s average of $839,524.
Days on Market
Homes in the Coachella Valley are currently spending an average of 67 days on the market. A longer days-on-market metric suggests that buyers are taking their time to make decisions, weighing their options carefully in the current environment.
Implications for Buyers and Sellers
For buyers, the uptick in inventory offers a broader range of choices and may reduce competition, which can lead to better negotiating opportunities. The decline in average sale prices also creates a more favorable environment for those looking to enter the market or upgrade their current living situation.
Sellers, however, may need to reassess their pricing strategies in light of the declining average sale price. With more properties available, competitive pricing becomes crucial to attracting potential buyers. (Courtesy of Palm Springs Tribune)
More
The summer of waiting here in the Coachella Valley.
The summer of waiting. I thought it was just the Coachella Valley, but now at the end of the summer, it’s clear that it is not a localized phenomena. Buyers and sellers alike are “waiting” For what? I’m hearing they’re waiting for the election to be over, for I rates to come down, for more inventory to come on. Guess what? If all the buyers and sellers are waiting, won’t that mean there will be more buyers coming out at the same time, competing for more inventory yes, but our inventory is so low, and buyers tend to focus on the same things out here in the desert. Hmmm..I have no idea what’s going to shake out, but it just feels strange. Local agent/realtor, Kim Kelly 760-285-3578.
Most of my out of area buyers believe there will be a deluge of inventory here in the Coachella Valley. That will mean they have more choices, and that the sellers will be more motivated to give them a “deal”. I sure hope they are right. From my point of view as a local realtor for 23 years, it means that the properties with the great locations, sun exposure, good floorplans, at the club or local area they want, will still be the ones the buyers are chasing. Those sellers will not have to lower their prices.
Local sellers are choosing to hold back their properties until I rates go down and the elections are over, because they believe there will be more buyers competing for their properties. They are probably correct. We are a seasonal locale, and buyers are pretty much looking for the same product. The good ones always sell! I don’t know what the solution will be, but I suspect 2025 is going to come out roaring in the real estate industry. Take a look at this home in the La Quinta cove that will be available in mid October.
More
Should I list my Coachella Valley home now, or wait?
Should I list now? A good client and friend of mine has decided to sell..but when? The Coachella Valley, like many real estate market right now, is sitting. What I mean is buyers are waiting, and sellers aren’t that flexible on their prices. If you are looking to buy or sell in the Coachella Valley, give local resident and agent, Kim Kelly a call at 760-285-3578.
Whether the market is a buyers market or a sellers market, the time you choose to list your property for sale depends on multiple factors.
- Do you need the money now, or can you wait?
- There is no crystal ball pointing to what will happen in the future. Your realtor, no matter how experienced, cannot predict what WILL happen. There could be a natural disaster, a war could break out; many things can influence the market.
- Review the comps carefully. How have homes like yours been moving in your area?
- In the current market, buyers are waiting. Two factors seem to be influencing their decision. The election and Interest rates. Boots on the ground, meaning lots of traffic through your house, may not be happening right now.
- If you decide to wait to list after looking closely at the market, understand that there is no guarantee the market will go up. It could just as easily go down.
In my local market, here in the Coachella Valley, price the property correctly, and the sellers still need to be open and flexible with offers. Our seasonal population starts arriving about mid October, so if you can wait for season, there will definitely be more eyeballs on your property. Price it right, be patient, and most of all don’t get insulted, but rather, respond to every offer!
More
